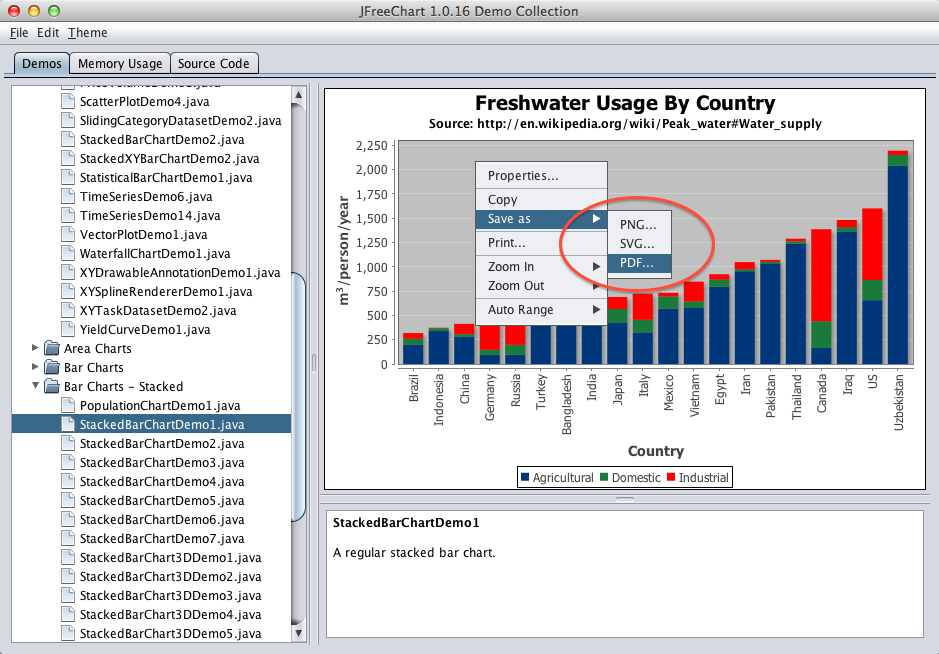
I want to show how easy it is to create 3D charts in a Java application, so here I will walk through the steps to create the following chart in a small Java Swing application:
![]()
The chart shows the number of survivors and non-survivors from the sinking of the Titanic, split between men vs women/children, and broken down by passenger class (1st, 2nd, 3rd and crew). The source of the data is
this paper (PDF). The background image is from
iStockPhoto.com.
The chart library I'm using is
Orson Charts, which comes in a single jar file (248kB) and uses its own built-in 3D rendering (so there is no dependency on JOGL, Java3D etc). It's made to be simple. It's not free.
The first step in creating this chart is to get the data in a form that can be used to create a bar chart (in fact, a stacked bar chart in this case). In Orson Charts, we've defined the
CategoryDataset3D interface as the source for data, and provide an easy-to-use implementation
StandardCategoryDataset3D (people that have used
JFreeChart, another chart library I developed, will find this approach very familiar). Here's the code to create the dataset---for each value we are specifying the series key (one series for survivors, another series for victims), a row key (men vs women/children) and a column key (passenger class):
    private static CategoryDataset3D createDataset() {
        StandardCategoryDataset3D dataset = new StandardCategoryDataset3D();
        dataset.addValue(146, "Survivors", "Women/Children", "1st");
        dataset.addValue(104, "Survivors", "Women/Children", "2nd");
        dataset.addValue(103, "Survivors", "Women/Children", "3rd");
        dataset.addValue(20, "Survivors", "Women/Children", "Crew");
        dataset.addValue(57, "Survivors", "Men", "1st");
        dataset.addValue(14, "Survivors", "Men", "2nd");
        dataset.addValue(75, "Survivors", "Men", "3rd");
        dataset.addValue(192, "Survivors", "Men", "Crew");
        dataset.addValue(4, "Victims", "Women/Children", "1st");
        dataset.addValue(13, "Victims", "Women/Children", "2nd");
        dataset.addValue(141, "Victims", "Women/Children", "3rd");
        dataset.addValue(3, "Victims", "Women/Children", "Crew");
        dataset.addValue(118, "Victims", "Men", "1st");
        dataset.addValue(154, "Victims", "Men", "2nd");
        dataset.addValue(387, "Victims", "Men", "3rd");
        dataset.addValue(670, "Victims", "Men", "Crew");
        return dataset;
    }
Take a look again at the screenshot to see how these data items correspond to the items in the chart (the series keys are shown in the legend, the row keys on the z-axis, the column keys on the x-axis, and the values are plotted against the y-axis).
Next, we will create a
Chart3D object configured with the required plot and renderer to create a stacked bar chart from this data. Here the
Chart3DFactory class does all the work for us (we just specify the chart title, subtitle, dataset, and axis labels---we pass null for the row axis because it doesn't need a label):
        CategoryDataset3D dataset = createDataset();
        Chart3D chart = Chart3DFactory.createStackedBarChart("The Sinking of the Titanic", "Survival data for 2,201 passengers",
                dataset, null, "Class", "Passengers");
At this point, the chart is ready to use. We're going to display this one in a Swing UI using the
ChartPanel3D class...but first we will make a few customisations of the default settings (add a background image, make the chart walls transparent, and change the bar colors).
The background image is added with the following code, which specifies the image and how it should be resized to fit the background (obviously the image is coming from a file on my desktop, so you should not use this code without modifying the image source):
        ImageIcon icon = new ImageIcon("/Users/dgilbert/Desktop/iStock_000003105870Small.jpg");
        RectanglePainter background = new StandardRectanglePainter(Color.WHITE,
                icon.getImage(), new Fit2D(TitleAnchor.CENTER,
                Scale2D.SCALE_BOTH));
        chart.setBackground(background);
The
Fit2D class allows control over the positioning and scaling of the image. The code here centers the image and scales it to fit the background rectangle (as I write this, I realise I can simplify the API here...that will get done in the next release).
Next, I make the chart-box (the walls of the 3D plot) transparent so that the background image is not completely obscured by the chart---to do this, just specify a color with an alpha-value of less than 255:
chart.setChartBoxColor(new Color(255, 255, 255, 155));
Finally, I change the default bar colors by customising the renderer. This will need a little bit of explaining:
        CategoryPlot3D plot = (CategoryPlot3D) chart.getPlot();
        StackedBarRenderer3D renderer = (StackedBarRenderer3D) plot.getRenderer();
        renderer.setColorSource(new StandardCategoryColorSource(
                new Color[] { new Color(50, 200, 50),
                new Color(200, 50, 50) }));
In Orson Charts, the Chart3D class is the top-level "umbrella" object and it keeps a reference to a Plot3D instance which in turn manages the dataset and renderer. There are different types of plots (
PiePlot3D,
CategoryPlot3D and
XYZPlot)...our stacked bar chart uses the CategoryPlot3D class so we first get a reference to the plot (applying the necessary cast---you can check the Chart3DFactory documentation to know what sort of plot your chart is using). The plot has a renderer---the type of renderer controls how the data is represented (bars, lines, areas etc). In our case the renderer is a
StackedBarRenderer3D, so we get a reference to this and again apply the necessary cast. Now we can apply whatever customisations we want to the renderer. In fact, here we just set the color source to use two custom shades of red and green for the series colors (once again, as I write this I can see the need to simplify the API here for the easy cases...look for that in the next release also).
Now we add the chart to our Swing UI using the ChartPanel3D class (and, in fact, we wrap that inside a
DisplayPanel3D to get the toolbar that you see in the screenshot). The call to zoomToFit() just ensures that the chart is sized to fit the available space in the panel:
        ChartPanel3D chartPanel = new ChartPanel3D(chart);
        chartPanel.zoomToFit(OrsonChartsDemo.DEFAULT_CONTENT_SIZE);
        content.add(new DisplayPanel3D(chartPanel));
And that's it. The complete source for the demo is
here (there's very little code in addition to what I've already shown you). I encourage you to download the free evaluation for Orson Charts, run the demos, and see for yourself how easy it is to create great looking 3D charts in Java.