It's Jon Stewart, not John Stewart. I apologise. I actually *knew* as I wrote my previous post that there *something* wrong with it, but I was tired and couldn't spot it - and hit POST anyway. I don't usually do that. And names are important. Sorry.
↧
It's Jon Stewart
↧
Merry Christmas
Merry Christmas, GNU Classpath hackers! You know who you are.
↧
↧
Resolutions
My resolutions for 2010:
- Learn a new language. French. 40 lessons start tonight;
- Pay off the credit card, and stop using it;
- Travel to FOSDEM and see if I can reconnect with the spirit and optimism of Free and Open Source software. Or just drink some very fine beer with some very fine friends;
- Make more JFreeChart releases, and find a more secure source of funding for the project;
- Put the interests of my family above all else.
↧
JFreeChart in 2010
JFreeChart is off to a great start in 2010 with two exciting new developments that I'm desperately trying to find the time to integrate into the JFreeChart sources. First, Gerrit Grunwald has been doing some stunning work on (amongst other things) a gauge component for Swing:
![]()
Check out Gerrit's presentation on Swing user interfaces, grab the sources for the gauge component, or follow his developments on Twitter (hansolo_).
The second, equally stunning, development is a 3D charting library, Jzy3D, developed by Martin Pernollet, based on JOGL and released under the New BSD License. Here's a sample:
![]()
Martin kindly approached me about integrating this library within JFreeChart, and I have started sifting through the code. But you don't have to wait, the code is available now...so try it out!

Check out Gerrit's presentation on Swing user interfaces, grab the sources for the gauge component, or follow his developments on Twitter (hansolo_).
The second, equally stunning, development is a 3D charting library, Jzy3D, developed by Martin Pernollet, based on JOGL and released under the New BSD License. Here's a sample:

Martin kindly approached me about integrating this library within JFreeChart, and I have started sifting through the code. But you don't have to wait, the code is available now...so try it out!
↧
Be The Change
So, yesterday was the 10 year anniversary of the first release of JFreeChart, and it slipped by without me noticing! I knew it was coming up, and even checked the exact date a few weeks back, but then on the day I had so much else to do. Life is like that at the moment. Anyway, tonight as I walked home from work I decided a small celebration was in order, so I bought a bottle of New Zealand sunshine and...cheers! Here's to 10 years, 50+ releases, 984+ bugs, 61,525 forum posts, 1.3 million downloads, and hundreds of millions of charts generated.
↧
↧
Do No Evil
↧
Do No Evil II
If you don't smile watching this, you're not human anymore:
http://www.youtube.com/watch?v=BD3ovfZXO5Q
http://www.youtube.com/watch?v=BD3ovfZXO5Q
↧
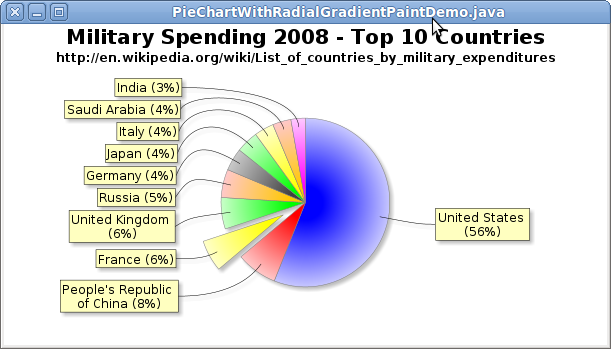
RadialGradientPaint and Pie Charts
JFreeChart doesn't have support for RadialGradientPaint out-of-the-box (yet), but it can be done if you follow the instructions in this post (note that reflection is being used in the code so that it will continue to compile and run on Java versions earlier than 1.6):
http://www.jfree.org/phpBB2/viewtopic.php?f=3&t=29410&start=0
Here is a screenshot showing a pie chart that uses the RadialGradientPaint modification:
![Screenshot-PieChartWithRadialGradientPaintDemo.java.png]()
Here is the source code for the demo above (requires the patches in the forum post referenced above to be applied to JFreeChart):
http://www.jfree.org/phpBB2/viewtopic.php?f=3&t=29410&start=0
Here is a screenshot showing a pie chart that uses the RadialGradientPaint modification:
Here is the source code for the demo above (requires the patches in the forum post referenced above to be applied to JFreeChart):
/*
 * (C) Copyright 2000-2010, by Object Refinery Limited.
 */

import java.awt.Color;
import java.awt.RadialGradientPaint;
import java.awt.geom.Point2D;
import javax.swing.JPanel;

import org.jfree.chart.ChartFactory;
import org.jfree.chart.ChartPanel;
import org.jfree.chart.JFreeChart;
import org.jfree.chart.labels.StandardPieSectionLabelGenerator;
import org.jfree.chart.plot.PiePlot;
import org.jfree.chart.title.TextTitle;
import org.jfree.data.general.DefaultPieDataset;
import org.jfree.data.general.PieDataset;
import org.jfree.ui.ApplicationFrame;
import org.jfree.ui.RefineryUtilities;

/**
 * A simple demo showing a pie chart using RadialGradientPaint.
 */
public class PieChartWithRadialGradientPaintDemo extends ApplicationFrame {

    /**
     * Default constructor.
     *
     * @param title  the frame title.
     */
    public PieChartWithRadialGradientPaintDemo(String title) {
        super(title);
        setContentPane(createDemoPanel());
    }

    /**
     * Creates a panel for the demo (used by SuperDemo.java).
     *
     * @return A panel.
     */
    public static JPanel createDemoPanel() {
        JFreeChart chart = createChart(createDataset());
        ChartPanel panel = new ChartPanel(chart);
        panel.setMouseWheelEnabled(true);
        return panel;
    }

    /**
     * Creates a sample dataset.
     *
     * @return A sample dataset.
     */
    private static PieDataset createDataset() {
        DefaultPieDataset dataset = new DefaultPieDataset();
        dataset.setValue("United States", 607.0);
        dataset.setValue("People's Republic of China", 84.9);
        dataset.setValue("France", 65.7);
        dataset.setValue("United Kingdom", 65.3);
        dataset.setValue("Russia", 58.6);
        dataset.setValue("Germany", 46.8);
        dataset.setValue("Japan", 46.3);
        dataset.setValue("Italy", 40.6);
        dataset.setValue("Saudi Arabia", 38.2);
        dataset.setValue("India", 30.0);
        return dataset;
    }

    /**
     * Creates a chart.
     *
     * @param dataset  the dataset.
     *
     * @return A chart.
     */
    private static JFreeChart createChart(PieDataset dataset) {

        JFreeChart chart = ChartFactory.createPieChart(
            "Military Spending 2008 - Top 10 Countries",
            dataset, false, // legend?
            true, // tooltips?
            false // URLs?
            );
        chart.addSubtitle(new TextTitle("http://en.wikipedia.org/wiki/List_of_countries_by_military_expenditures"));
        PiePlot plot = (PiePlot) chart.getPlot();
        plot.setLabelGenerator(new StandardPieSectionLabelGenerator("{0} ({2})"));
        plot.setBackgroundPaint(Color.WHITE);
        plot.setOutlinePaint(null);
        Point2D center = new Point2D.Float(0, 0);
        float radius = 200;
        float[] dist = {0.2f, 1.0f};

        RadialGradientPaint p = new RadialGradientPaint(center, radius, dist,
              new Color[] {Color.BLUE, new Color(200, 200, 255)});
        plot.setSectionPaint("United States", p);

        RadialGradientPaint p2 = new RadialGradientPaint(center, radius, dist,
              new Color[] {Color.RED, new Color(255, 200, 200)});
        plot.setSectionPaint("People's Republic of China", p2);

        RadialGradientPaint p3 = new RadialGradientPaint(center, radius, dist,
              new Color[] {Color.YELLOW, new Color(255, 255, 200)});
        plot.setSectionPaint("France", p3);
        plot.setExplodePercent("France", 0.30);

        RadialGradientPaint p4 = new RadialGradientPaint(center, radius, dist,
              new Color[] {Color.GREEN, new Color(200, 255, 200)});
        plot.setSectionPaint("United Kingdom", p4);

        RadialGradientPaint p5 = new RadialGradientPaint(center, radius, dist,
              new Color[] {Color.ORANGE, new Color(255, 200, 200)});
        plot.setSectionPaint("Russia", p5);

        RadialGradientPaint p6 = new RadialGradientPaint(center, radius, dist,
              new Color[] {Color.DARK_GRAY, new Color(200, 200, 200)});
        plot.setSectionPaint("Germany", p6);

        RadialGradientPaint p7 = new RadialGradientPaint(center, radius, dist,
              new Color[] {Color.GREEN, new Color(200, 255, 200)});
        plot.setSectionPaint("Japan", p7);

        RadialGradientPaint p8 = new RadialGradientPaint(center, radius, dist,
              new Color[] {Color.YELLOW, new Color(255, 255, 200)});
        plot.setSectionPaint("Italy", p8);

        RadialGradientPaint p9 = new RadialGradientPaint(center, radius, dist,
              new Color[] {Color.ORANGE, new Color(255, 200, 200)});
        plot.setSectionPaint("Saudi Arabia", p9);

        RadialGradientPaint p10 = new RadialGradientPaint(center, radius, dist,
              new Color[] {Color.MAGENTA, new Color(255, 200, 255)});
        plot.setSectionPaint("India", p10);

        return chart;

    }

   /**
    * The starting point for the demo.
    *
    * @param args
    *            ignored.
    */
   public static void main(String[] args) {

        // ******************************************************************
        //  More than 150 demo applications are included with the JFreeChart
        //  Developer Guide...for more information, see:
        //
        //  >   http://www.object-refinery.com/jfreechart/guide.html
        //
        // ******************************************************************

        PieChartWithRadialGradientPaintDemo demo = new PieChartWithRadialGradientPaintDemo("PieChartWithRadialGradientPaintDemo.java");
        demo.pack();
        RefineryUtilities.centerFrameOnScreen(demo);
        demo.setVisible(true);
   }
}
↧
Waste Management
↧
↧
The JFreeChart Forum Is Back
I (finally) found the time to clean up and re-enable the JFreeChart forum following a spamming incident in July. The spam muppets thought it would be a good idea to post 50,000 entries in the forum, my web-hosting company rightly thought it was not such a good idea. Now it is fixed.
↧
JFreeChart 1.0.14
The 61st public release of JFreeChart is now available for download. This release contains support for multiple and logarithmic axes with PolarPlot, optional drop-shadows in plot rendering, fitting polynomial functions to a data series, some performance improvements in the TimeSeriesCollection class, mouse wheel rotation of pie charts, improved Maven support and numerous bug fixes.
Patches:
- 3435734 : Fix lines overlapping item labels (by Martin Hoeller);
- 3421088 : Bugfix for misalignment in BoxAndWhiskerRenderer;
- 2952086 : Enhancement for finding bounds in XYZDatasets;
- 2954302 : CategoryPointerAnnotation line calculation;
- 2902842 : HistogramDataset.addSeries() fires change change event (by Thomas A Caswell);
- 2868608 : Whisker width attribute for BoxAndWhiskerRenderer (by Peter Becker);
- 2868585 : Added useOutlinePaint flag for BoxAndWhiskerRenderer (by Peter Becker);
- 2850344 : PolarPlot enhancements (by Martin Hoeller);
- 2795746 : Support for polynomial regression;
- 2791407 : Fixes for findRangeBounds() in various renderers.
Bug Fixes:
- 3440237 : Shadows always visible;
- 3432721 : PolarPlot doesn't work with logarithmic axis;
- 3433405 : LineChart3D - Problem with Item Labels;
- 3429707 : LogAxis endless loop;
- 3428870 : Missing argument check in TextAnnotation;
- 3418287 : RelativeDateFormatTest.java is locale dependent;
- 3353913 : Localisation fixes for ChartPanel, CompassPlot and PiePlot3D;
- 3237879 : RingPlot should respect getSectionOutlineVisible();
- 3190615 : Added missing clear() method in CategoryTableXYDataset;
- 3165708 : PolarChartPanel localisation fix;
- 3072674 : Bad handling of NaN in DefaultStatisticalCategoryDataset;
- 3035289 : StackedXYBarRenderer should respect series/item visible flags;
- 3026341 : Check for null in getDomain/RangeBounds() for XYShapeRenderer;
- 2947660 : AbstractCategoryRenderer fix null check in getLegendItems();
- 2946521 : StandardDialScale check majorTickIncrement argument;
- 2876406 : TimeTableXYDataset should support Comparable for series keys;
- 2868557 : BoxAndWhiskerRenderer should fire change event in setMedianVisible();
- 2849731 : For IntervalCategoryDataset and IntervalXYDataset, fix iterateRangeBounds() in DatasetUtilities;
- 2840132 : AbstractXYItemRenderer drawAnnotations doesn't set renderer index;
- 2810220 : Offset problem in StatisticalBarRenderer;
- 2802014 : Dial value border too small;
- 2781844 : XYPointerAnnotation arrow drawing;
- 1937486 : AreaRenderer doesn't respect AreaRendererEndType.LEVEL;
Also fixed:
- use of simple label offset in PiePlot;
- cached minY and maxY in TimeSeries.createCopy();
- scaling issues for charts copied to the clipboard;
- use of timezone in TimeTableXYDataset constructor;
- duplicate series names in XYSeriesCollection;
- HistogramDataset fires a change event in addSeries();
- check visibility of main chart title before drawing it;
- fixed serialization of PowerFunction2D, NormalDistributionFunction2D, and LineFunction2D;
- item label positioning for the AreaRenderer class when the plot has an horizontal orientation.
↧
JFreeChart 1.0.14 - New Features I
Over the coming weeks, I aim to post a few entries highlighting some of the new features in JFreeChart 1.0.14. I hope also that the examples (there will be source code) will encourage developers to experiment with the multitude of settings in JFreeChart to customise the appearance of their charts. It is a common (and fair) criticism that the default "look" in JFreeChart is dated (some even say ugly but they are not very polite)...but with a few calls to the right API methods, you can radically change the resulting output.
I'll start with the new support for Java's RadialGradientPaint in pie charts, which gives an opportunity for developers to liven up the appearance of these charts with only a small amount of additional effort (you need Java 6 or later for this to work, since RadialGradientPaint does not exist in earlier Java runtimes). You can simply call the existing setSectionPaint() method of the PiePlot class and pass it a RadialGradientPaint instance, as the following example illustrates:

Here is the corresponding source code:
/* -----------------
 * PieChartDemo.java
 * -----------------
 * (C) Copyright 2011, by Object Refinery Limited.
 */

package demo;

import java.awt.BasicStroke;
import java.awt.Color;
import java.awt.Dimension;
import java.awt.Font;
import java.awt.GradientPaint;
import java.awt.Point;
import java.awt.RadialGradientPaint;
import java.awt.geom.Point2D;

import javax.swing.JPanel;

import org.jfree.chart.ChartFactory;
import org.jfree.chart.ChartPanel;
import org.jfree.chart.JFreeChart;
import org.jfree.chart.StandardChartTheme;
import org.jfree.chart.plot.PiePlot;
import org.jfree.chart.title.TextTitle;
import org.jfree.data.general.DefaultPieDataset;
import org.jfree.data.general.PieDataset;
import org.jfree.ui.ApplicationFrame;
import org.jfree.ui.HorizontalAlignment;
import org.jfree.ui.RectangleEdge;
import org.jfree.ui.RectangleInsets;
import org.jfree.ui.RefineryUtilities;

/**
 * A demo for a pie chart using RadialGradientPaint in JFreeChart 1.0.14.
 */
public class PieChartDemo extends ApplicationFrame {

    private static final long serialVersionUID = 1L;

    {
        // set a theme using the new shadow generator feature available in
        // 1.0.14 - for backwards compatibility it is not enabled by default
        ChartFactory.setChartTheme(new StandardChartTheme("JFree/Shadow",
                true));
    }

    /**
     * Default constructor.
     *
     * @param title  the frame title.
     */
    public PieChartDemo(String title) {
        super(title);
        setContentPane(createDemoPanel());
    }

    /**
     * Creates a sample dataset.
     *
     * Source: http://www.bbc.co.uk/news/business-15489523
     *
     * @return A sample dataset.
     */
    private static PieDataset createDataset() {
        DefaultPieDataset dataset = new DefaultPieDataset();
        dataset.setValue("Samsung", new Double(27.8));
        dataset.setValue("Others", new Double(55.3));
        dataset.setValue("Nokia", new Double(16.8));
        dataset.setValue("Apple", new Double(17.1));
        return dataset;
    }

    /**
     * Creates a chart.
     *
     * @param dataset  the dataset.
     *
     * @return A chart.
     */
    private static JFreeChart createChart(PieDataset dataset) {

        JFreeChart chart = ChartFactory.createPieChart(
            "Smart Phones Manufactured / Q3 2011",  // chart title
            dataset,            // data
            false,              // no legend
            true,               // tooltips
            false               // no URL generation
        );

        // set a custom background for the chart
        chart.setBackgroundPaint(new GradientPaint(new Point(0, 0),
                new Color(20, 20, 20), new Point(400, 200), Color.DARK_GRAY));

        // customise the title position and font
        TextTitle t = chart.getTitle();
        t.setHorizontalAlignment(HorizontalAlignment.LEFT);
        t.setPaint(new Color(240, 240, 240));
        t.setFont(new Font("Arial", Font.BOLD, 26));

        PiePlot plot = (PiePlot) chart.getPlot();

        plot.setBackgroundPaint(null);
        plot.setOutlineVisible(false);

        // use gradients and white borders for the section colours
        plot.setSectionPaint("Others", createGradientPaint(new Color(200, 200, 255), Color.BLUE));
        plot.setSectionPaint("Samsung", createGradientPaint(new Color(255, 200, 200), Color.RED));
        plot.setSectionPaint("Apple", createGradientPaint(new Color(200, 255, 200), Color.GREEN));
        plot.setSectionPaint("Nokia", createGradientPaint(new Color(200, 255, 200), Color.YELLOW));
        plot.setBaseSectionOutlinePaint(Color.WHITE);
        plot.setSectionOutlinesVisible(true);
        plot.setBaseSectionOutlineStroke(new BasicStroke(2.0f));

        // customise the section label appearance
        plot.setLabelFont(new Font("Courier New", Font.BOLD, 20));
        plot.setLabelLinkPaint(Color.WHITE);
        plot.setLabelLinkStroke(new BasicStroke(2.0f));
        plot.setLabelOutlineStroke(null);
        plot.setLabelPaint(Color.WHITE);
        plot.setLabelBackgroundPaint(null);

        // add a subtitle giving the data source
        TextTitle source = new TextTitle("Source: http://www.bbc.co.uk/news/business-15489523",
                new Font("Courier New", Font.PLAIN, 12));
        source.setPaint(Color.WHITE);
        source.setPosition(RectangleEdge.BOTTOM);
        source.setHorizontalAlignment(HorizontalAlignment.RIGHT);
        chart.addSubtitle(source);
        return chart;

    }

    /**
     * A utility method for creating gradient paints.
     *
     * @param c1  color 1.
     * @param c2  color 2.
     *
     * @return A radial gradient paint.
     */
    private static RadialGradientPaint createGradientPaint(Color c1, Color c2) {
        Point2D center = new Point2D.Float(0, 0);
        float radius = 200;
        float[] dist = {0.0f, 1.0f};
        return new RadialGradientPaint(center, radius, dist,
                new Color[] {c1, c2});
    }

    /**
     * Creates a panel for the demo (used by SuperDemo.java).
     *
     * @return A panel.
     */
    public static JPanel createDemoPanel() {
        JFreeChart chart = createChart(createDataset());
        chart.setPadding(new RectangleInsets(4, 8, 2, 2));
        ChartPanel panel = new ChartPanel(chart);
        panel.setMouseWheelEnabled(true);
        panel.setPreferredSize(new Dimension(600, 300));
        return panel;
    }

    /**
     * Starting point for the demonstration application.
     *
     * @param args  ignored.
     */
    public static void main(String[] args) {

        // ******************************************************************
        //  More than 150 demo applications are included with the JFreeChart
        //  Developer Guide...for more information, see:
        //
        //  >   http://www.object-refinery.com/jfreechart/guide.html
        //
        // ******************************************************************

        PieChartDemo demo = new PieChartDemo("JFreeChart: Pie Chart Demo 1");
        demo.pack();
        RefineryUtilities.centerFrameOnScreen(demo);
        demo.setVisible(true);
    }

}
↧
JFreeChart 1.0.14 - New Features II
Another key feature in the JFreeChart 1.0.14 release is the option to render drop-shadows within plots, aimed at charts that will be rendered on-screen. The effect of this is quite subtle, but noticeable if you compare two charts directly, one with the shadows and one without:

Compare this to the same chart generated without the drop shadow:
I had resisted adding this feature in the past, because it means dropping down to bit-map level operations, and the rest of JFreeChart is based purely on vector primitives...but in the end, there were too many people that wanted this and, like most things in JFreeChart, the developer can configure it however he or she prefers.
Utilising this feature will incur some overhead in memory usage, but is very simple to switch on - simply add the following line near the start of your application (before any charts are created):
ChartFactory.setChartTheme(new StandardChartTheme("JFree/Shadow", true));
There are other more direct ways as well, for example see the setShadowGenerator() method in the XYPlot class.
↧
↧
FOSDEM
I'll be fighting the cold and the snow to get to Brussels this weekend for FOSDEM 2012. See you there!
↧
KNIME Open Source Days / JFreeChart
I've been invited to the KNIME Open Source Days (it's on this week) at the University of Konstanz to talk about the future of JFreeChart and to learn more about KNIME. Should be fun! I'll be there on Thursday afternoon and evening.
↧
JFreeChart - Future State Edition
A development version of JFreeChart is now hosted on GitHub:
https://github.com/jfree/jfreechart-fse
The README.md explains where I'm going with this, and it is just a click away so I won't repeat it here.
Why GitHub? Everyone has been telling me how good it is, so finally I have decided to try it out. So far, I'm using Git a bit like SVN, which probably means I'm doing it wrong...but I'll learn some of the subtleties over time. Or not.
People have also finally given up trying to convince me to use Maven for the JFreeChart builds so, at least for this dev version, I've started using Maven. In fact, this is helping me out quite a bit, because I switch between a few different machines, and the excellent out-of-the-box Maven support in NetBeans means I can just open my JFreeChart project via the pom file and start working. Git integration in NetBeans is really smooth too, again out-of-the-box which is something I really appreciate. NetBeans has finally converted me - after many years of using Eclipse, I've stopped installing it.
Final note...JFreeChart 1.0.15 really is on the way!
↧
The Rise of Chrome
I was a bit surprised last week when a colleague told me that Chrome (the web browser) now has greater than 40% market share. Last time I saw figures, admittedly some time ago, it was running at about 20%. Anyway, I looked it up and found this source:
http://www.w3schools.com/browsers/browsers_stats.asp
The rise of Chrome is certainly impressive, and also interesting in that data is the long fall of Internet Explorer. The dataset, of course, may not provide a good representation of global usage (it is based on visitor logs for W3C only)...if you know of better, or just alternative, data I'd be interested to know the source, for comparison.
I'm always on the lookout for interesting data sets to use for the JFreeChart demo collection, so I created this chart based on a subset of the browser data:
![demo15.png]()
I like this chart, and will most likely try to keep it up-to-date in the coming months. If I can find some data that splits out desktop vs mobile browsing, that would be interesting as well. In the meantime, I'll go and give Chrome another try.
http://www.w3schools.com/browsers/browsers_stats.asp
The rise of Chrome is certainly impressive, and also interesting in that data is the long fall of Internet Explorer. The dataset, of course, may not provide a good representation of global usage (it is based on visitor logs for W3C only)...if you know of better, or just alternative, data I'd be interested to know the source, for comparison.
I'm always on the lookout for interesting data sets to use for the JFreeChart demo collection, so I created this chart based on a subset of the browser data:

I like this chart, and will most likely try to keep it up-to-date in the coming months. If I can find some data that splits out desktop vs mobile browsing, that would be interesting as well. In the meantime, I'll go and give Chrome another try.
↧
↧
JFreeChart 1.0.15
A new release of JFreeChart is now available for download. This release contains support for non-visible series in XYBarRenderer, minor gridlines in PolarPlot, new legend item ordering options, chart editor enhancements, updates to StandardDialScale, localisation files for Japanese, refactored parameter checks and a fix for a minor security flaw in the DisplayChart class, detected and reported by OSI Security: http://www.osisecurity.com.au/advisories/jfreechart-path-disclosure.
Here is a sample chart created by JFreeChart:
Patches:
- 3500621 : LegendTitle order attribute (by Simon Kaczor);
- 3463807 : ChartComposite does not dispose popup (by Sebastiao Correia);
- 3204823 : PaintAlpha for 3D effects (by Dave Law);
Bug Fixes:
- 3561093 : Rendering anomaly for XYPlots;
- 3555275 : ValueAxis.reserveSpace() problem for axes with fixed dimension;
- 3521736 : DeviationRenderer optimisation (by Milan Ramaiya);
- 3514487 : SWTGraphics2D get/setStroke() problem;
- 3508799 : DefaultPolarItemRenderer does not populate seriesKey in LegendItem;
- 3482106 : Missing text in SWTGraphics2D (by Kevin Xu);
- 3484408 : Maven fixes (Martin Hoeller);
- 3484403 : DateAxis endless loop (by Martin Hoeller);
- 3446965 : TimeSeries calculates range incorrectly in addOrUpdate();
- 3445507 : TimeSeriesCollection.findRangeBounds() regression;
- 3425881 : XYDifferenceRenderer fix (by Patrick Schlott/Christoph Schroeder);
- 2963199 : SWT print job (by Jonas Rüttimann);
- 2879650 : Path disclosure vulnerability in DisplayChart servlet;
Also fixed a rendering issue for polar charts using an inverted axis.
Please help to spread the word about JFreeChart (blogs, tweets and word-of-mouth are all appreciated), and if you are using JFreeChart at your company please consider supporting our project by purchasing the JFreeChart Developer Guide and demo source code. Financial support is critically important for the project.
TweetSpecial thanks to the whole team at SourceForge for providing more than a decade of free infrastructure and hosting to the JFreeChart project!
↧
Reaching for the Web
Follow @jfreechart![]()
![]()
![]()
I decided it is well past the right time for me to learn more about graphics technologies on the web so, after wrapping up the JFreeChart 1.0.15 release on Monday, I started exploring. Those of you that haven't been living under a rock for the last few years (as I have been) will already know that the HTML5 Canvas element has an API that's, more or less, functionally equivalent to the Java2D API. I had to convince myself of this, of course, so I wrote a general purpose Java class (CanvasGraphics2D) that maps Graphics2D API calls in Java and emits corresponding Javascript code, and hooked it up to JFreeChart. The result is pretty nice, even if not that useful (the generated Javascript paints a picture with a fixed dimension so, coming from Java, we might as well have just provided a PNG image directly...with a bit of Javascript wizardry there is probably a solution to that, but not now). Here's the output for a sample chart (click here for the live Javascript version) which also tells us some interesting things about how browser usage is changing:

After running CanvasGraphics2D on many of the JFreeChart demo charts and seeing the output, I'm not as reluctant as I once was to learn more Javascript! Thankfully the tools for writing and debugging Javascript have improved also so in the near future...well we'll see.
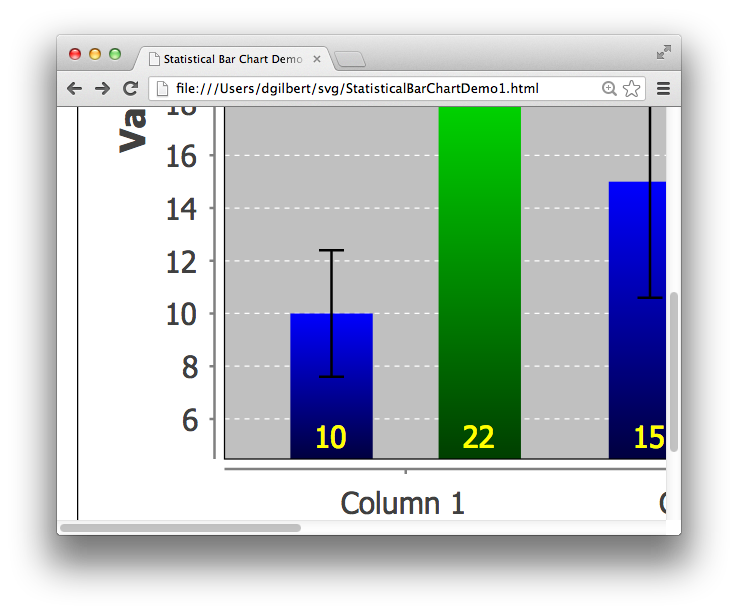
Alongside Canvas, browser support for the Scalable Vector Graphic (SVG) format appears to have evolved considerably during my time under the rock. So following my success in creating a working CanvasGraphics2D in a short space of time, and being in 'R&D' mode at the moment, I decided to have a go at a light-weight SVGGraphics2D implementation (Batik exists for a long time, but I don't think it can be described as light-weight). This also didn't take all that long, and after connecting it up to JFreeChart here's the result (click here for the "live"SVG version):
This format is a bit more useful coming from Java than the output from CanvasGraphics2D because SVG has built-in support for scaling, so the quality of the image is retained as it is scaled in the browser (or anywhere else), which is nicer than what you get from PNG or other image formats:
Furthermore, the SVG format can be used in a lot of other places besides the browser, so this light-weight SVGGraphics2D class has some utility.
It is working well with JFreeChart, but I have a little more work to do on it (there is no image support so far, and the clipping and transforming code also needs some work). Once it is complete, I plan to attach a proprietary (gasp) licence to it and include it as a small bonus to developers that purchase the JFreeChart Developer Guide...and give an additional incentive for people to (financially) support my open source work.
Follow @jfreechart↧
19 Free / Open Source Java Chart Libraries
This morning I updated the JFreeChart FAQ, in particular the item listing alternative free / open source chart libraries (it's always been there just in case JFreeChart doesn't meet your requirements). There are now 19 projects listed, some of them look quite decent. Just now I added the year of the most recent release in square brackets (please let me know if I made any errors in that, the intent was to help identify projects that are still alive):
- the JZY3D project (BSD) [2013];
- the XChart project (Apache 2.0) [2013];
- the Project Waterloo (LGPLv3) [2013];
- the GRAL project (LGPLv3) [2013];
- the JChart2D project (LGPL) [2013];
- the JenSoft Java Chart API (GPLv3) [2012];
- the JRobin project (LGPL) [2011];
- the PtPlot project (UC Berkeley copyright) [2010];
- the SurfacePlotter project (LGPL) [2010];
- the LiveGraph project (BSD) [2010];
- the OpenChart2 project (LGPL) [2009];
- the JHeatChart project (LGPL) [2008];
- the QN Plot project (BSD) [2007];
- the E-Gantt project (Q Public License) [2006];
- the Java Chart Construction Kit (LGPL, works with JDK 1.1.8) [2005];\ li>
- the jCharts project (BSD-style) 2004[];
- the ThunderGraph project (LGPL) [2002];
- the Chart2D project (LGPL) [2002];
- the JOpenChart project (LGPL) [2002];
- the MagPlot project (GPL) previously at https://magplot.dev.java.net/;
↧